South Dakota Gov. Kristi Noem said she is disappointed in recent statewide standardized test scores indicating that just over half of students were proficient in English language and fewer than half showed proficiency in math and science.
The results of the South Dakota Department of Education 2019 Report Card, based on standardized tests, showed that about 54% of students tested in grades three through eight and in 11th grade showed proficiency in reading and writing. Only about 47% of those same students were proficient in math for their respective grade levels, and roughly 40% of students were proficient in science.
Gov. Noem told South Dakota News Watch that she was unimpressed with the results during an interview two days after the statewide report card was released to the public on Sept. 17.
“I’m not happy with those numbers and we are having that conversation as we speak,” Noem said. “We just got those numbers and we will be having conversations about how to improve those numbers for our students.”
Despite a half-cent sales tax increase passed in 2016 that generated new revenue to boost pay for South Dakota’s roughly 9,700 teachers, student test scores have not increased since then. Over the last three academic years, statewide proficiency scores for math, reading and writing have remained essentially flat. The scores for science proficiency actually fell from the 2017-18 school year, when the science test was first administered, to the 2018-19 school year.
At least part of the reason scores haven’t increased is that South Dakota started using a newer, more difficult assessment test during the 2016-17 school year. Comparing results from the old test to the new test isn’t fair, state Education Secretary Ben Jones said. The biennially administered National Assessment of Educational Progress, which has used, essentially the same testing methods since 2003, shows flat scores for reading between 2015 and 2017, while math scores rose slightly between 2015 and 2017.

A deeper look at the student test data show that South Dakota’s education system — which includes about 135,000 students at 681 schools in 149 districts — is falling short in some specific population groups.
One of the most persistent and pervasive struggles has been in the area of Native American student achievement. Statewide, just 23% of Native American students tested as proficient in reading and writing. The numbers were worse for math at 14% proficient and science at 13% proficient.
The on-time graduation rate for Native American students was 30 percentage points lower than the state average, at around 54% statewide. Native American students’ rate of high school completion by the age of 21 was 66%, 24 percentage points below the state’s total student population.
Another area of concern has been the achievement gap among economically disadvantaged students, Jones said. South Dakota defines economically disadvantaged students as those who qualify for free or reduced-price lunches and the state report card shows such students finish high school at lower rates and tend to score lower on assessment tests than those without financial disadvantages. Statewide, 36% of economically disadvantaged students tested as proficient in reading and writing, 28% were deemed proficient in math and 25% were shown to be proficient in science.
There is some correlation between an individual district’s performance and the number of economically disadvantaged students enrolled there.
In Brandon Valley, one of the state’s best performing districts as measured by test scores, there were 442 economically disadvantaged students who took the state assessment tests last year, comprising about 20% of the district’s test-takers. Overall, 72% of the district’s students were deemed to be proficient in reading and writing, 66% were proficient in math and 57% were proficient in science. Meanwhile, about 54% of the district’s economically disadvantaged students were deemed proficient in reading and writing, 46% were proficient in math and 40% were proficient in science.
Roughly 55% of the students who took the state assessment tests in the Huron school district, meanwhile, were considered economically disadvantaged. Overall, 47% of the district’s students tested as proficient in reading and writing, 39% were considered proficient in math and 32% were deemed proficient in science. Economically disadvantaged students in the district tested as 36% proficient in reading and writing, 29% were proficient in math and 19% were proficient in science.
“It’s challenging to teach reading, writing and arithmetic when a child is hungry, when a child is upset because of something not in that child’s control,” said Mary McCorkle, president of the South Dakota Education Association that represents teachers.

At least part of the state’s struggle to address the Native American and economically disadvantaged student achievement gap is that the state’s data collection practices have been fairly inconsistent, Jones said. Standardized assessment tests didn’t get too much weight in the state’s education system until about 2001, when the federal No Child Left Behind Act became law. The act forced states to begin evaluating schools using standard metrics and then report the results to the federal Department of Education as a condition of receiving federal aid dollars.
South Dakota’s assessment regime has undergone several major changes over the years between legislative battles over the Common Core national education standards and efforts to devise a better testing system, Jones said. The current version of the state’s science assessment, for example, has only been in place for two full academic years, meaning there isn’t enough data yet to draw strong conclusions. Inconsistent data has made identifying trends more difficult which, in turn, has made figuring out what to do about problem areas more challenging, Jones said.
For the last four years, though, South Dakota has been using the same assessments for math as well as reading and writing for four years, Jones said. There’s enough information now to begin finding solutions. At Noem’s direction, Jones said he has assembled a committee of education officials and state leaders in order to address the state’s achievement gaps.
“We’re on the verge of those decisions,” Jones said. “I think we’ll have some recommendations in a fairly timely manner.”
Student test scores by district
Here is a look at how students fared in terms of proficiency in three subject areas, based on standardized tests, from the 2019 South Dakota Report Card for several school districts across the state.
District English Math Science
Aberdeen 60% 51% 38%
Brookings 59% 46% 48%
Brandon Valley 72% 66% 57%
Douglas (Box Elder) 55% 48% 39%
Huron 47% 39% 32%
Harrisburg 62% 56% 47%
Meade (Sturgis) 59% 51% 51%
Mitchell 58% 56% 37%
Pierre 60% 54% 54%
Rapid City 51% 43% 37%
Sioux Falls 51% 44% 42%
Spearfish 55% 49% 42%
Watertown 65% 56% 51%
Yankton 62% 53% 47%
Source: S.D. Report Card, 2019
Standardized tests a snapshot of achievement
Standardized tests have taken on greater importance in the U.S. education system in recent years as national education officials and policymakers have sought ways to compare and grade student achievement between states, districts and population groups.
Yet despite the recent poor results in South Dakota, some education officials say the test scores are only a single snapshot of student performance and cannot paint a full picture of student knowledge or achievement. They note that some national statistics and rankings show South Dakota students are actually performing better than some of their peers.
McCorkle said there are many factors at play when it comes to education quality that cannot be accounted for in a single test.
“It’s easy to look at a report card and assign a positive or a negative to a number without going below the surface,” McCorkle said. “I think students are more than a four-hour test score.”
About 84% of South Dakota’s class of 2019 passed required math, English and science courses on top of other requirements and also graduated on time, state data show. Another 6% were projected to graduate before they turn 21, according to the state report card. Overall, the state high school completion rate was projected to be 90%.
The state report card also said that nearly two-thirds of state high school students passed at least one course that could result in earning a college or tech school credit or toward certification in a skilled trade. Meanwhile, 56% of students were deemed assessment ready, meaning they were proficient on at least one state assessment test. About 48% of state students both tested as proficient and passed a dual credit, Advanced Placement or trade-preparation class to earn the distinction of being college or career ready.
About 67% of state high school graduates are going on to higher education of some type. Roughly half of the state’s high school diploma holders go on to seek a four-year degree. Another 16% pursue two-year degrees. To enroll at a public university in South Dakota, a student needs a composite ACT score of 18 or to be in the top 60% of their class or to maintain at least a 2.6 grade point average throughout high school.
The state’s six public universities had an average freshman retention rate of 72% for the 2018-19 school year. Roughly 63% of students who started college finished within six years, according to the South Dakota Board of Regents.
Looking beyond South Dakota’s borders provides some positive context for the state’s statistical picture, at least when it comes to college-bound students. South Dakotans who take the ACT score slightly higher, on average, than other states that see similar numbers of students take that test. South Dakota students averaged a score of 21.9 in 2018, very close to scores in Iowa, where students’ average score was 21.8, and in Kansas where students averaged 21.6.
The federal Department of Education’s National Assessment of Educational Progress, or NAEP, which evaluates fourth, eighth and 12th grade students’ skills in reading, math, and science also shows that South Dakota’s students, on average, are faring pretty well when compared to their peers.
In 2017, the latest year for which NAEP data is available, 69% of South Dakota fourth-graders showed at least a basic level of reading comprehension, two percent more than fourth graders at the national level. In math, 83% of South Dakota fourth-graders showed a basic or better understanding of math, which was four percentage points higher than the national number.
South Dakota eighth-graders also outperformed their peers. In math, 76% of eighth-graders showed a basic or better understanding of the subject, which was seven percentage points higher than the national number. Meanwhile, 80% of South Dakota’s eighth-graders showed at least a basic level of reading comprehension, while 75% of eighth-graders nationally showed the same level of reading comprehension.
The latest science scores for both eighth- and fourth-graders are from 2015. South Dakotans at both grade levels outperformed the nation as a whole. About 77% of the state’s eighth-graders showed basic or better understanding of science, while 81% of fourth-graders showed a basic or better level of understanding, both levels slightly higher than the national average.
Some improvements being made
The Huron school district’s troubles cannot be explained solely due to economic disparity, as the district also has one of the state’s most diverse student populations. More than 50% of the district’s students are non-white. Meanwhile, roughly 34% of the district’s students are considered English Language Learners, a designation that can encompass children of refugees to Hutterite children who grew up speaking German dialects. Many ELL students struggle with assessment tests simply due to the language barrier.
English Language Learners are one of the fastest-growing demographics in the state’s schools, Jones said. Not having a good grasp of English slows a student’s progress across all school subjects. In recognition of that fact, many schools across the state have made a point of improving ELL students’ progress.
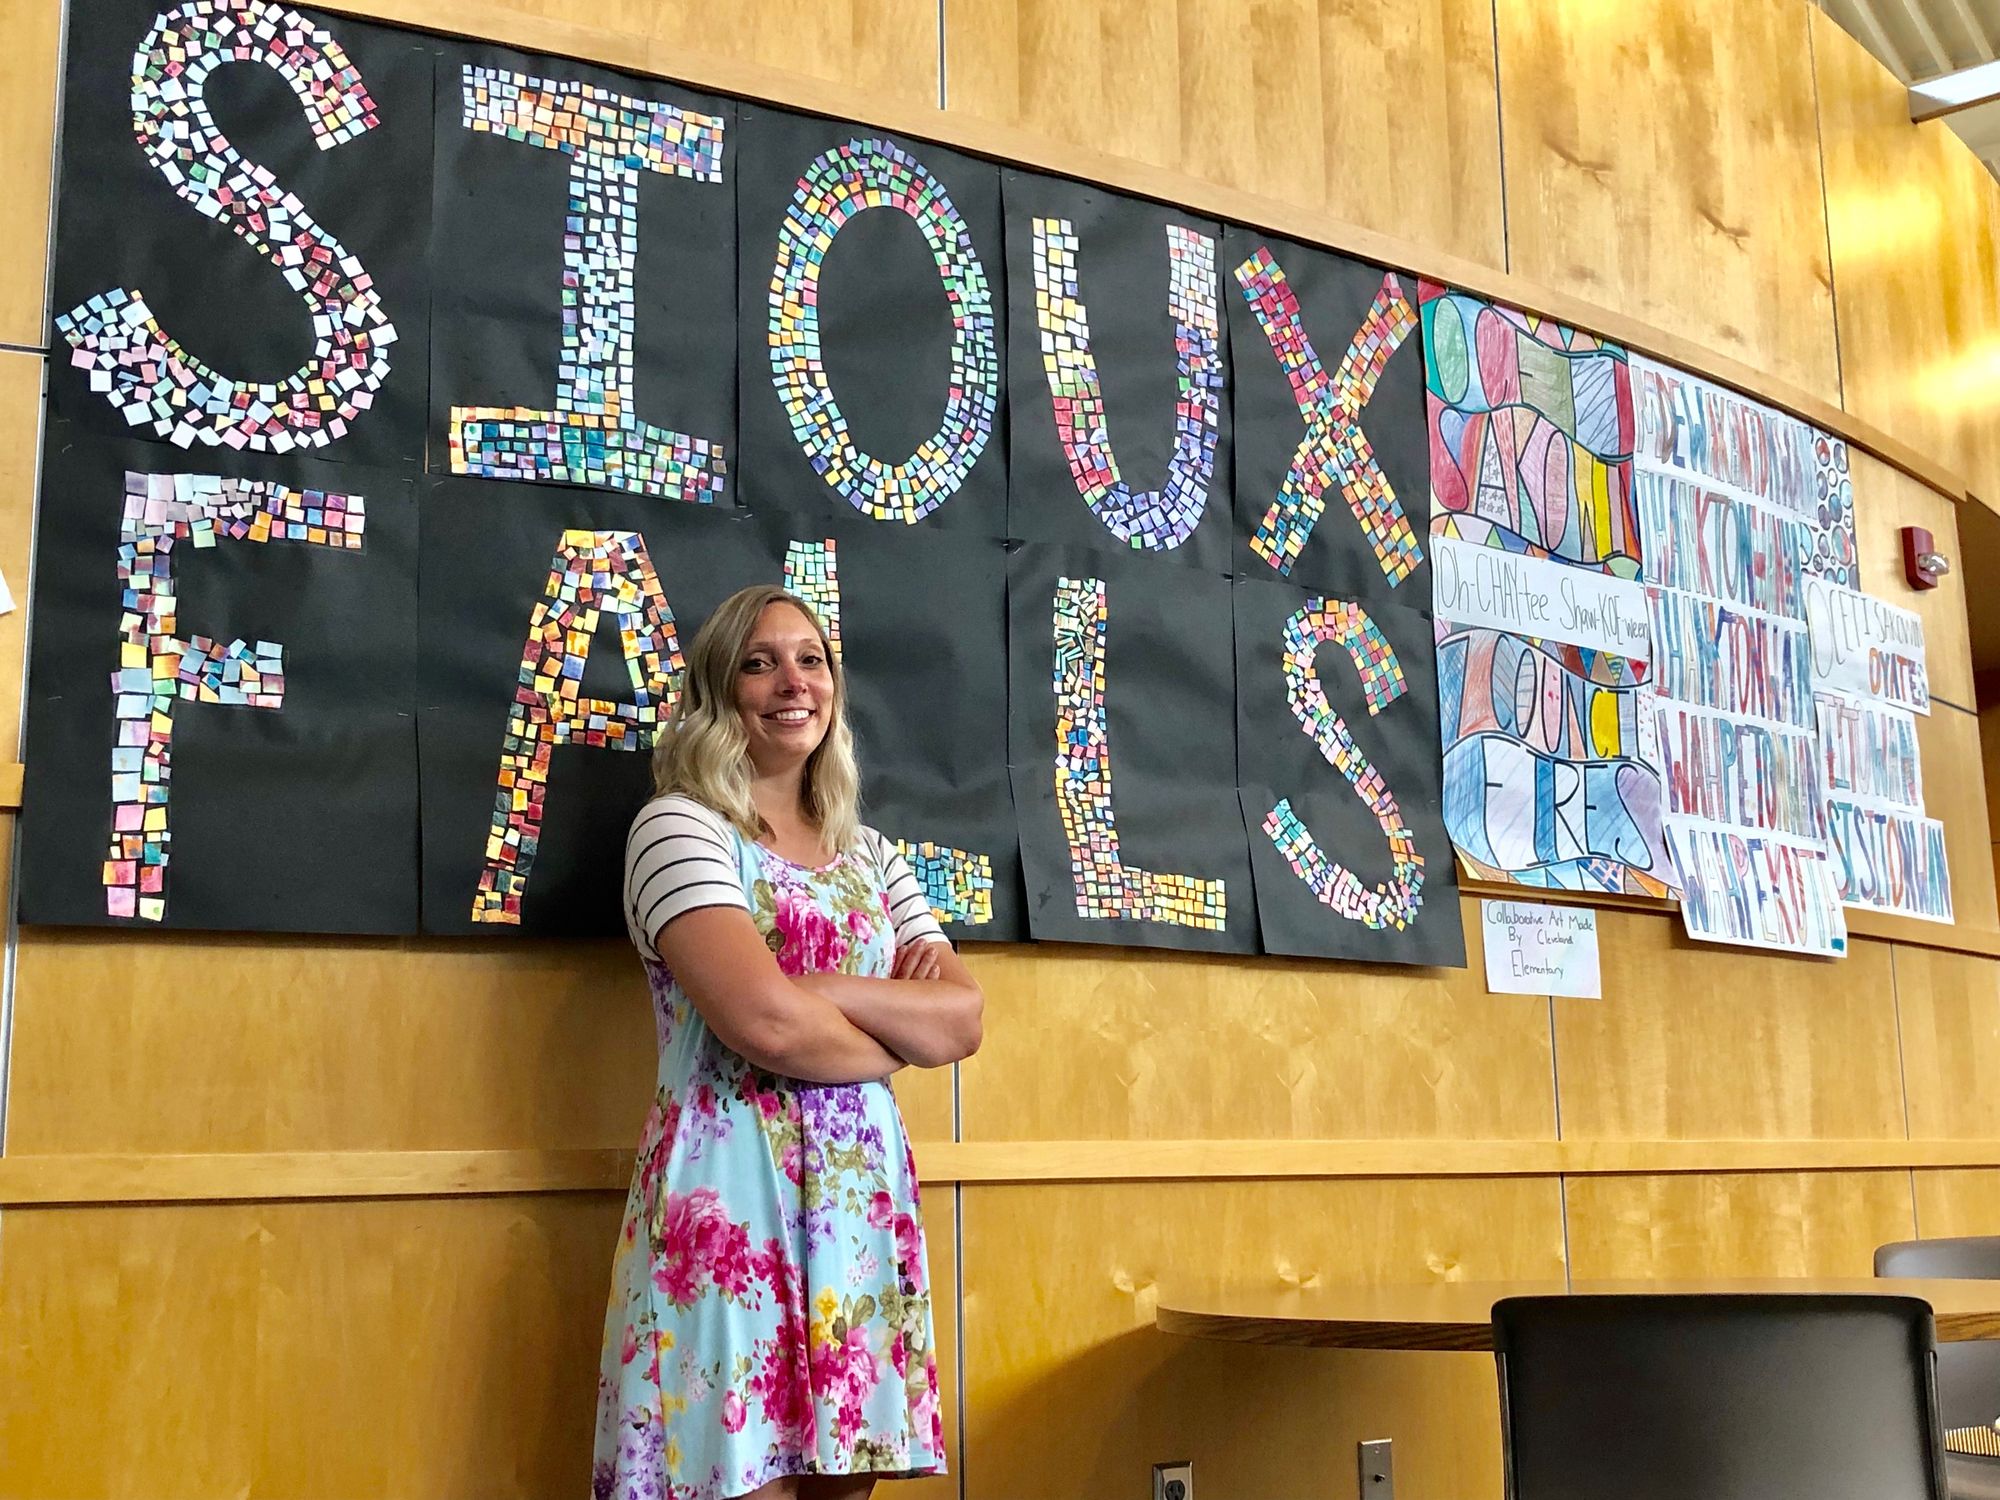
The Sioux Falls school district has been offering up to six classes specifically for ELL students in high school during the district’s summer term in June, in addition to the ELL classes offered during the school year. Three summer classes were for language skills development, one was speech, another was personal finance and the final class teaches algebra skills. The classes themselves are free to students and were paid for by federal grants, said Sara Klaahsen, who coordinates the program for the district.

The district’s summer English language development classes used field trips with local officials, such as Sioux Falls Mayor Paul TenHaken and local business owners, to help reinforce the language skills the students were learning, Klaahsen said.
“If we can offer four days per week where these students get to practice these language skills over the summer, that’s less they’ll have to make up during the school year,” Klaahsen said.
That and similar programs were a big part of the 12% jump in the number of English language learners who were on track to master the language during the last school year, Jones said.
Still, one of the biggest things that South Dakotans need to do if they want to see student performance improve is to get involved with their local schools, both Jones and McCorkle said.
One way South Dakota schools are working to get Native American parents more involved in schools is by expanding the native language curricula, Jones said. There have been great improvements in how the Lakota, Dakota and Nakota languages can be taught, he said.
Parental involvement in education has long been one of the biggest predictors of student success, McCorkle said, and if the wider community gets involved, outcomes can improve even more.
“If you really want to find out how your schools are doing, the best approach is to have conversations with the educators who work with students every day,” McCorkle said.


